Our Three Step Process
May 25, 2026
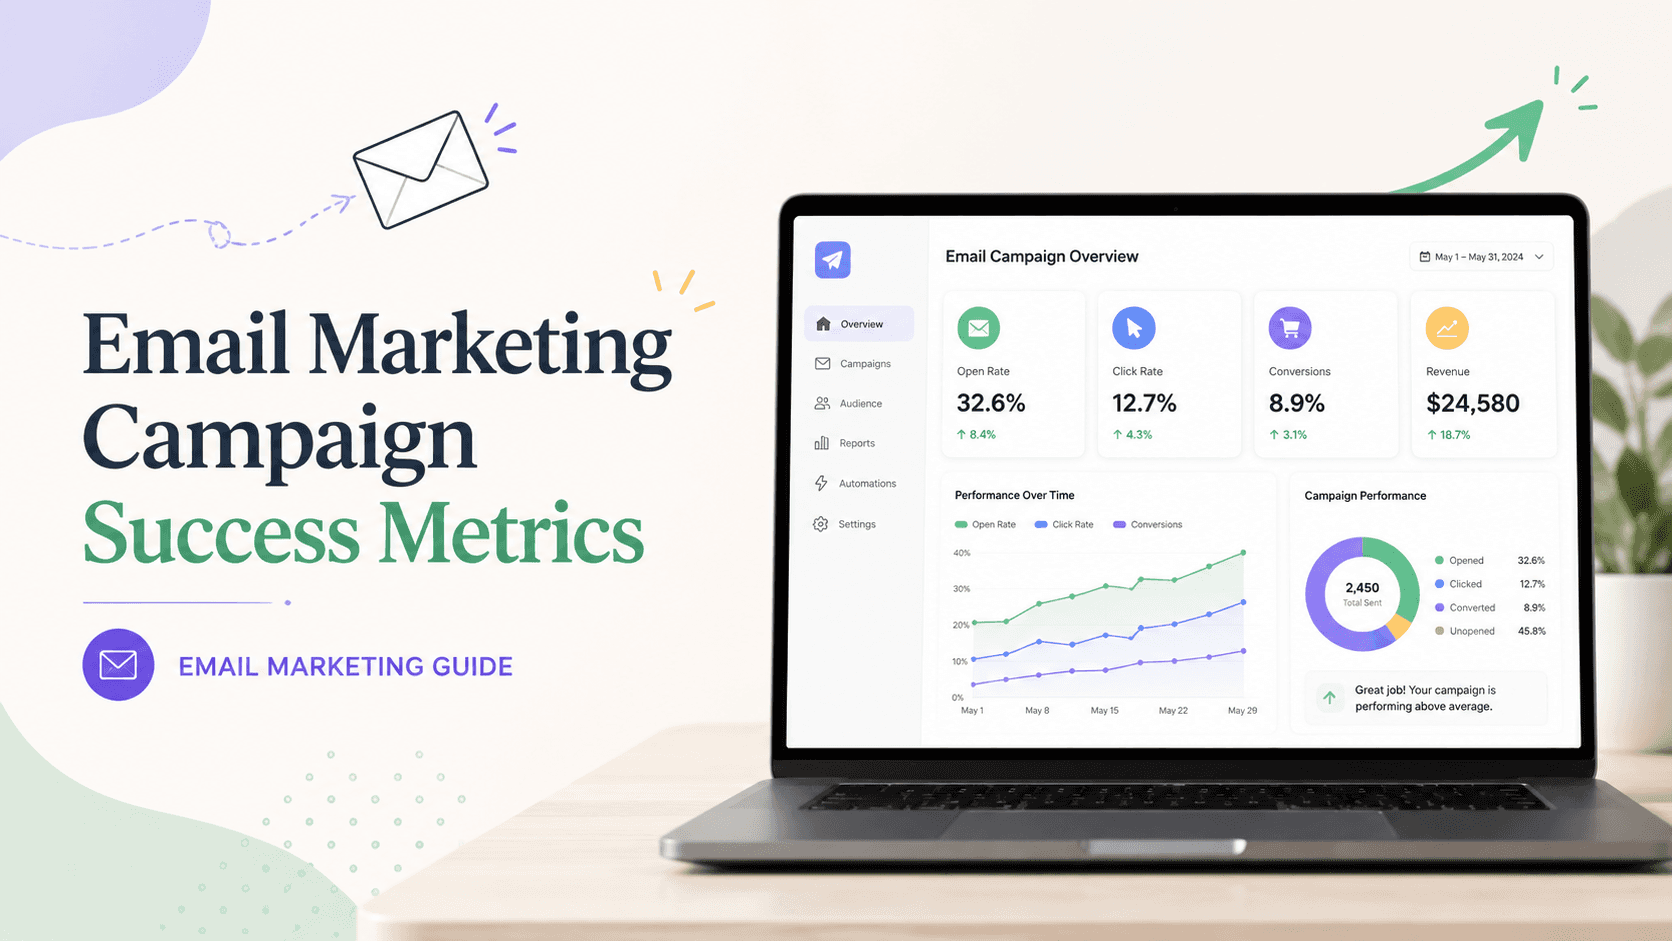
Master Your Campaigns: Understanding 2026 Email Marketing Benchmarks
Our Three Step Process
May 25, 2026
Master Your Campaigns: Understanding 2026 Email Marketing Benchmarks
Master your 2026 email marketing benchmarks. Understand key metrics like open rates, CTR, and conversion rates to optimize campaigns and drive growth.
Alright, so we're talking about email marketing benchmarks for 2026. It's not just another year, really. Things are changing with privacy rules and AI popping up everywhere. But here's the thing: email is still a goldmine for businesses, especially for B2C brands. Gartner even says it's a big deal. You can't just send emails and hope for the best, though. You need to know how you're doing. That's where these benchmarks come in. Think of them as your starting point, not your finish line. We'll look at five key email marketing benchmarks that top brands are watching, and how you can do even better.
Key Takeaways
Email marketing benchmarks are your guide to seeing how well your emails are performing compared to others.
Don't just look at one number; check a few different metrics to get the full picture of your campaign's health.
Keep your email list clean by watching bounce and unsubscribe rates. This helps your emails actually get delivered.
Use these benchmarks to figure out what's working and what's not, so you can make your emails better.
Remember that what works for one industry might not work for another, so compare yourself to similar businesses.
Understanding Key Email Marketing Benchmarks For 2026
The Evolving Landscape of Email Marketing
Alright, let's talk about email marketing in 2026. It's not your grandma's email anymore, you know? Things have really shifted. New privacy rules mean we can't just blast emails out like we used to. Plus, AI is doing some pretty wild stuff, changing how we create and tweak campaigns on the fly. And honestly, people's attention spans seem shorter than ever. Still, email is a powerhouse for making money, especially for businesses selling directly to customers. Itâs a channel you own, and thatâs gold. Gartner even said prospect email marketing is a big deal this year. But just making money isn't the whole story; you need to show how well you're doing.
Email isn't about sending tons of messages anymore. It's about sending the right messages to the right people. In 2026, using benchmarks to make smart choices is key. Think of the average numbers not as a target, but as a starting point. The goal is to consistently do better than the average.
Why Email Marketing Benchmarks Are Crucial
So, why bother with these numbers? Well, benchmarks are like a report card for your email efforts. They show you how you stack up against others in your field and against what's generally considered good performance. This helps you figure out what's working and, more importantly, what's not. Without them, you're kind of flying blind. You need these numbers to set sensible goals and to prove that your email campaigns are actually doing something for the business. They help you see where you can make changes to get better results.
Benchmarks give you a reference point. They help you understand if your open rates are decent, if people are actually clicking your links, and if your emails are leading to sales. It's all about making informed decisions instead of just guessing.
Foundational Metrics for Campaign Health
When you're starting out or just want a quick check on how things are going, there are a few core numbers you should always keep an eye on. These give you a basic picture of your campaign's health.
Here are some of the most important ones to start with:
Open Rate: This tells you how many people actually opened your email after seeing it in their inbox. Itâs your first impression metric.
Click-Through Rate (CTR): This measures how many people clicked on a link within your email after opening it. It shows if your content is interesting enough to make people take the next step.
Conversion Rate: This is the big one â it tracks how many people completed a desired action (like making a purchase or signing up) after clicking through from your email. This directly ties your email efforts to business results.
Bounce Rate: This indicates the percentage of emails that couldn't be delivered. A high bounce rate can hurt your sender reputation and means you're wasting resources on bad addresses. Keeping this low is vital for maintaining a healthy email list.
Looking at these numbers regularly will give you a solid understanding of your email marketing performance and where you might need to make adjustments.
Core Email Marketing Benchmarks To Track

When you're sending out emails, you need to know if they're actually doing anything, right? It's not enough to just hit send and hope for the best. We've got to look at some numbers to see what's working and what's not. These are the basics, the stuff you should be checking on every single campaign.
Open Rate: The Initial Engagement Indicator
This is pretty straightforward: it's the percentage of people who opened your email out of everyone who received it. Think of it as the first hurdle. If people aren't opening your emails, nothing else matters. A good open rate means your subject line and sender name are doing their job. For February 2026, e-commerce campaigns saw an average open rate around 47.40%, which is a decent starting point to compare against [d66c].
Subject Line Effectiveness: Does it grab attention?
Sender Recognition: Do people know and trust who it's from?
Timing: Are you sending at the right time for your audience?
Low open rates can signal a problem with your list's health or how you're presenting your emails before they're even opened.
Click-Through Rate: Measuring Content Resonance
Okay, so they opened it. Now, did they click on anything inside? That's your click-through rate (CTR). This tells you if your email's content, offers, or calls to action are interesting enough to make people take the next step. It's a big indicator of whether your message is hitting the mark.
Metric | Average (Approx.) |
|---|---|
Email CTR | 2.5% - 3.5% |
Conversion Rate: Driving Tangible Business Outcomes
This is where the rubber meets the road. Did the click lead to a sale, a signup, a download, or whatever goal you set for the email? The conversion rate measures the actual business results. It's the ultimate test of whether your email marketing is making money or achieving its objectives. Without conversions, even high open and click rates are just vanity metrics.
Bounce Rate: Maintaining List Health
Not everyone on your list is going to be a valid email address. Some emails will 'bounce' â meaning they couldn't be delivered. There are two types:
Hard Bounces: Permanent issues, like a fake email address. These should be removed immediately.
Soft Bounces: Temporary issues, like an inbox being full. These might resolve themselves, but keep an eye on them.
A high bounce rate is bad news. It hurts your sender reputation and wastes your sending resources. Keeping this number low is key to a healthy email program. You can find more general benchmarks for email marketing performance [f99c].
Advanced Email Marketing Benchmarks For Deeper Insights
So, you've got the basics down â open rates, click-throughs, the whole deal. That's great! But to really get a handle on what's happening with your emails and make them work harder, you need to look a bit closer. These next few metrics give you a more detailed picture, helping you fine-tune your approach.
Click-To-Open Rate (CTOR): Gauging Content Effectiveness
This one tells you how many people who opened your email actually clicked on something inside. It's a better measure of your content's appeal than just the raw click-through rate because it filters out those who just glanced at the subject line. A high CTOR means your email body content is doing its job.
What it measures: The percentage of openers who clicked a link.
Calculation: (Total Clicks / Total Emails Opened) * 100
Why it matters: It shows if your message and call-to-action are compelling enough to make people act.
Unsubscribe Rate: Understanding Audience Sentiment
Nobody likes seeing people leave, but a small unsubscribe rate is normal. What you're looking for is a sudden spike or a consistently high rate. This tells you something might be off â maybe your content isn't relevant anymore, you're sending too often, or your audience has changed.
What it measures: The percentage of recipients who unsubscribed.
Calculation: (Total Unsubscribes / Total Emails Delivered) * 100
What to watch for: A rate above 0.5% might need investigation.
Spam Complaint Rate: Protecting Sender Reputation
This is a big one. If people mark your emails as spam, it seriously damages your ability to reach inboxes in the future. It's a direct signal to email providers that your messages aren't wanted. Keeping this rate as close to zero as possible is non-negotiable.
What it measures: The percentage of recipients who marked your email as spam.
Calculation: (Total Spam Complaints / Total Emails Delivered) * 100
Ideal target: Below 0.1%
Revenue Per Email (RPE): Quantifying Financial Impact
For businesses focused on sales, this metric is gold. It directly links your email efforts to the money you're making. It helps you understand the actual financial return from each email you send, making it easier to justify your marketing spend.
What it measures: The average revenue generated by each email sent.
Calculation: Total Revenue Generated from Email / Total Emails Sent
Usefulness: Helps compare the profitability of different campaigns or segments.
Looking at these deeper metrics helps you move beyond surface-level engagement. It's about understanding the why behind the numbers and making smarter decisions for your email strategy. Think of it like a doctor checking your vitals â you need more than just your temperature to know how you're really doing.
By paying attention to CTOR, unsubscribe rates, spam complaints, and RPE, you gain a much clearer view of your email campaign's true performance and its impact on your business. This level of detail is key for making informed adjustments and improving your overall email marketing performance.
Leveraging Email Marketing Benchmarks For Growth

So, you've got your numbers â open rates, click-throughs, the whole deal. Now what? Just looking at them isn't going to magically make your campaigns better. You've got to actually use them. Think of these benchmarks not as a report card, but as a roadmap. They show you where you are and, more importantly, where you need to go.
Setting Realistic Performance Goals
First off, don't just aim for the average. The average open rate, for instance, might be around 25.55% across all industries, but that's just a starting point. Your goal should be to beat it. When you set targets, make them specific and achievable. Instead of saying 'improve open rates,' try 'increase open rates by 3% next quarter.' This gives you something concrete to work towards. It's like training for a race; you don't just show up, you train for a specific time.
Identifying Areas for Optimization
Look at your metrics. Are your open rates good but your click-through rates (CTR) are lagging? That tells you people are opening your emails, but the content isn't grabbing them enough to click. Maybe the subject line is great, but the email body isn't delivering on the promise. Or perhaps your conversion rates are low even with a decent CTR. This could mean the landing page isn't aligned with the email, or the offer isn't compelling enough once they get there. It's all about connecting the dots between different metrics to see the full picture.
Here's a quick way to spot issues:
High Open Rate, Low CTR: Your subject lines are working, but the email content needs a serious rethink. Is it engaging? Is the call to action clear?
Low Open Rate, High CTR (for those who open): People who do open are interested, but not enough people are opening. Your subject lines or sender name might need tweaking. Maybe it's time to look at your sender reputation.
High CTR, Low Conversion Rate: The email is driving clicks, but the destination isn't converting. Check your landing page experience and offer.
High Bounce Rate: Your list is likely full of old or invalid addresses. This hurts deliverability and wastes money.
A/B Testing Strategies Based on Benchmarks
Benchmarks are perfect for guiding your A/B tests. If your CTR is underperforming, test different calls to action (CTAs) or image placements within your emails. If open rates are the issue, experiment with new subject line formats or send times. For example, you could test a question-based subject line against a benefit-driven one. Or try sending one version of an email at 10 AM and another at 2 PM to see which performs better for your audience. The key is to test one element at a time so you know exactly what change made a difference.
Benchmarks aren't static. What worked last year might not work today. The digital world moves fast, and so should your strategy. Regularly reviewing your performance against current industry averages and your own past results is how you stay ahead. Itâs about continuous improvement, not just hitting a number once.
Improving Sender Reputation Through Metrics
Your sender reputation is like your credit score for email. Metrics like bounce rate and spam complaint rate directly impact it. A high bounce rate means you're sending to bad addresses, and a high spam complaint rate means people are actively marking your emails as unwanted. Both are red flags to email providers (like Gmail or Outlook) and can lead to your emails landing in the spam folder, or worse, getting blocked entirely. By actively cleaning your list and monitoring these rates, you protect your ability to reach your audience. Itâs a bit like keeping your house tidy; it makes visitors feel more welcome.
Industry-Specific Email Marketing Benchmarks
So, you've got your general email marketing numbers looking pretty good. That's awesome. But here's the thing: not all emails, and not all audiences, are created equal. What works for a fashion brand might totally flop for a software company. It's super important to compare your results against others in your specific field. Trying to hit the average open rate for, say, the travel industry when you're selling industrial equipment just isn't going to give you a clear picture.
How Benchmarks Vary Across Sectors
Think about it. A quick email about a flash sale for a clothing store is going to get a different reaction than a detailed newsletter explaining a new financial product. The urgency, the content, the audience's expectations â it all shifts. For instance, a transactional email confirming an order will likely have a much higher open rate than a promotional blast. We're seeing conversion rates, for example, swing wildly. A good email marketing conversion rate can be anywhere from 2% to 5% generally, but that's just a starting point. For a high-ticket item, hitting 2% is fantastic. For something like groceries, where repeat purchases are common, you might see numbers much higher, like 7.9% or more.
Here's a peek at how conversion rates can look in different areas:
Industry | Conversion Rate |
|---|---|
Beauty | 1.92% |
Fashion | 1.4% |
Fintech | 5.8% |
Pets | 2.77% |
Food and beverage | 0.19% |
Grocery | 7.9% |
Furniture and home goods | 3.03% |
Retail | 2.25% |
Travel and hospitality | 2.25% |
Comparing Your Performance Against Averages
When you're looking at your own campaign data, always ask yourself: who am I comparing this to? Are they sending similar types of emails? Do they have a similar list size? Are they targeting a similar customer base? If you're sending out a welcome series, you'd want to look at the benchmarks for welcome series, not just general broadcast emails. Automated flows, like abandoned cart reminders, often perform way better than one-off campaigns. We're talking 10-15% recovery for abandoned carts, which is a huge difference from a standard 1-5% for broadcast messages. Keeping an eye on these specific email marketing benchmarks helps you see where you're truly excelling and where you might be falling behind.
Tailoring Strategies to Your Industry
So, what does this mean for you? It means you can't just use a one-size-fits-all approach. If your open rates are consistently lower than the general average, maybe it's time to rethink your subject lines or sending times. A typical email open rate might hover around 15-25%, but if your industry is known for lower engagement, that average might be your target. You need to adjust your expectations and your strategies based on what's realistic for your niche. For example, if you're in B2B manufacturing, your conversion rate might be around 2.18%, and that's perfectly fine. But if you're in retail and you're only hitting 0.5%, you've got some work to do. It's all about context.
Understanding these industry nuances is key. It stops you from getting discouraged by numbers that aren't relevant to your business and helps you focus on making real improvements where they count. Don't just aim for the average; aim to be the best in your specific sector.
Regularly checking your performance against industry-specific data helps you:
Identify realistic goals for your campaigns.
Spot opportunities to improve specific metrics like click-through rates or conversion rates.
Understand what kind of content truly connects with your audience.
Make smarter decisions about your email marketing budget and efforts.
By focusing on benchmarks that actually matter to your business, you can refine your approach and see better results over time.
Maximizing ROI With Email Marketing Benchmarks
So, you've been tracking all those numbers â open rates, click-throughs, the whole deal. That's great. But how do you actually turn those metrics into more money in the bank? Itâs not just about sending emails; itâs about making sure those emails are actually doing something for your business. Think of benchmarks not just as scores, but as a roadmap to better profits.
Connecting Metrics to Business Value
Itâs easy to get lost in the weeds with data. But every number should point back to what matters: revenue, customer loyalty, and overall business growth. For instance, a high click-through rate (CTR) is good, but what happens after the click? Does it lead to a sale? A sign-up? A demo request? That's the real value. We need to see how our email efforts directly impact the bottom line. Some studies show email marketing can bring in a return of $45 for every $1 spent, which is pretty wild when you think about it. Email marketing offers a significant return on investment (ROI).
Demonstrating Email Marketing's Profitability
Showing that email marketing is a money-maker isn't always straightforward. You need to connect the dots between your campaigns and actual sales. This means looking beyond just engagement metrics and focusing on conversion rates and, ultimately, revenue per email (RPE). If your campaigns are driving more purchases or higher-value actions, you can confidently say email is paying for itself, and then some.
Hereâs a simple way to think about it:
Engagement Metrics (Opens, Clicks): These show people are interested.
Action Metrics (Conversions): These show people are doing what you want them to do.
Revenue Metrics (Sales, RPE): This shows you're making money.
Optimizing for Customer Lifetime Value (LTV)
Beyond the immediate sale, think about the long game. How are your emails helping you keep customers around and spending more over time? This is where Customer Lifetime Value (LTV) comes in. Benchmarks can help you see if your email strategies are building loyalty. Are welcome series emails leading to repeat purchases? Are post-purchase follow-ups reducing churn? By keeping your email list clean and sending relevant content, you're not just making a sale today; you're building a relationship that pays off for years. Maintaining a clean and accurate email list is key here, as it ensures you're talking to people who actually want to hear from you, making them more likely to stick around.
The real win with email marketing isn't just getting someone to open an email or click a link. It's about building a relationship that encourages repeat business and makes customers feel valued over the long haul. That's how you get the best return, not just once, but again and again.
Wrapping It Up
So, we've looked at what's working in email marketing for 2026. It's clear that just sending emails isn't enough anymore. You've got to pay attention to the numbers, like how many people open your emails and click on things. These benchmarks aren't just random figures; they're a roadmap. Use them to see where you stand and where you can do better. Remember, the goal isn't just to hit the average, but to beat it. Keep an eye on these metrics, make smart adjustments, and your email campaigns will thank you for it.
Frequently Asked Questions
What exactly are email marketing benchmarks?
Think of benchmarks as a way to measure how well your emails are doing compared to others. They are like target scores, such as how many people open your emails or click on links, that help you see if your campaigns are performing well or need improvement.
Why should I care about these email benchmarks?
Benchmarks are super important because they show you if your emails are hitting the mark. They help you understand what's working and what's not, so you can make your emails better and get more people to pay attention and take action.
What are the most important things to track in my emails?
You should definitely keep an eye on how many people open your emails (open rate), how many click on the links inside (click-through rate), and how many actually do what you want them to do, like buying something (conversion rate). Also, watch out for emails that don't get delivered (bounce rate).
Can I use benchmarks to make my emails better?
Absolutely! By looking at benchmarks, you can find out which parts of your emails aren't doing so well. This helps you try new things, like changing your subject lines or the pictures you use, to see if you can get better results.
Do the best email numbers change depending on the type of business?
Yes, they do! What's considered good for an online store might be different for a news website. It's important to compare your results to businesses that are similar to yours to get a clearer picture.
How can tracking benchmarks help my business make more money?
When you know what works best in your emails, you can send more effective messages. This leads to more people clicking, buying, and becoming loyal customers, which directly boosts your business's earnings and shows how valuable email marketing is.
Master your 2026 email marketing benchmarks. Understand key metrics like open rates, CTR, and conversion rates to optimize campaigns and drive growth.
Alright, so we're talking about email marketing benchmarks for 2026. It's not just another year, really. Things are changing with privacy rules and AI popping up everywhere. But here's the thing: email is still a goldmine for businesses, especially for B2C brands. Gartner even says it's a big deal. You can't just send emails and hope for the best, though. You need to know how you're doing. That's where these benchmarks come in. Think of them as your starting point, not your finish line. We'll look at five key email marketing benchmarks that top brands are watching, and how you can do even better.
Key Takeaways
Email marketing benchmarks are your guide to seeing how well your emails are performing compared to others.
Don't just look at one number; check a few different metrics to get the full picture of your campaign's health.
Keep your email list clean by watching bounce and unsubscribe rates. This helps your emails actually get delivered.
Use these benchmarks to figure out what's working and what's not, so you can make your emails better.
Remember that what works for one industry might not work for another, so compare yourself to similar businesses.
Understanding Key Email Marketing Benchmarks For 2026
The Evolving Landscape of Email Marketing
Alright, let's talk about email marketing in 2026. It's not your grandma's email anymore, you know? Things have really shifted. New privacy rules mean we can't just blast emails out like we used to. Plus, AI is doing some pretty wild stuff, changing how we create and tweak campaigns on the fly. And honestly, people's attention spans seem shorter than ever. Still, email is a powerhouse for making money, especially for businesses selling directly to customers. Itâs a channel you own, and thatâs gold. Gartner even said prospect email marketing is a big deal this year. But just making money isn't the whole story; you need to show how well you're doing.
Email isn't about sending tons of messages anymore. It's about sending the right messages to the right people. In 2026, using benchmarks to make smart choices is key. Think of the average numbers not as a target, but as a starting point. The goal is to consistently do better than the average.
Why Email Marketing Benchmarks Are Crucial
So, why bother with these numbers? Well, benchmarks are like a report card for your email efforts. They show you how you stack up against others in your field and against what's generally considered good performance. This helps you figure out what's working and, more importantly, what's not. Without them, you're kind of flying blind. You need these numbers to set sensible goals and to prove that your email campaigns are actually doing something for the business. They help you see where you can make changes to get better results.
Benchmarks give you a reference point. They help you understand if your open rates are decent, if people are actually clicking your links, and if your emails are leading to sales. It's all about making informed decisions instead of just guessing.
Foundational Metrics for Campaign Health
When you're starting out or just want a quick check on how things are going, there are a few core numbers you should always keep an eye on. These give you a basic picture of your campaign's health.
Here are some of the most important ones to start with:
Open Rate: This tells you how many people actually opened your email after seeing it in their inbox. Itâs your first impression metric.
Click-Through Rate (CTR): This measures how many people clicked on a link within your email after opening it. It shows if your content is interesting enough to make people take the next step.
Conversion Rate: This is the big one â it tracks how many people completed a desired action (like making a purchase or signing up) after clicking through from your email. This directly ties your email efforts to business results.
Bounce Rate: This indicates the percentage of emails that couldn't be delivered. A high bounce rate can hurt your sender reputation and means you're wasting resources on bad addresses. Keeping this low is vital for maintaining a healthy email list.
Looking at these numbers regularly will give you a solid understanding of your email marketing performance and where you might need to make adjustments.
Core Email Marketing Benchmarks To Track
When you're sending out emails, you need to know if they're actually doing anything, right? It's not enough to just hit send and hope for the best. We've got to look at some numbers to see what's working and what's not. These are the basics, the stuff you should be checking on every single campaign.
Open Rate: The Initial Engagement Indicator
This is pretty straightforward: it's the percentage of people who opened your email out of everyone who received it. Think of it as the first hurdle. If people aren't opening your emails, nothing else matters. A good open rate means your subject line and sender name are doing their job. For February 2026, e-commerce campaigns saw an average open rate around 47.40%, which is a decent starting point to compare against [d66c].
Subject Line Effectiveness: Does it grab attention?
Sender Recognition: Do people know and trust who it's from?
Timing: Are you sending at the right time for your audience?
Low open rates can signal a problem with your list's health or how you're presenting your emails before they're even opened.
Click-Through Rate: Measuring Content Resonance
Okay, so they opened it. Now, did they click on anything inside? That's your click-through rate (CTR). This tells you if your email's content, offers, or calls to action are interesting enough to make people take the next step. It's a big indicator of whether your message is hitting the mark.
Metric | Average (Approx.) |
|---|---|
Email CTR | 2.5% - 3.5% |
Conversion Rate: Driving Tangible Business Outcomes
This is where the rubber meets the road. Did the click lead to a sale, a signup, a download, or whatever goal you set for the email? The conversion rate measures the actual business results. It's the ultimate test of whether your email marketing is making money or achieving its objectives. Without conversions, even high open and click rates are just vanity metrics.
Bounce Rate: Maintaining List Health
Not everyone on your list is going to be a valid email address. Some emails will 'bounce' â meaning they couldn't be delivered. There are two types:
Hard Bounces: Permanent issues, like a fake email address. These should be removed immediately.
Soft Bounces: Temporary issues, like an inbox being full. These might resolve themselves, but keep an eye on them.
A high bounce rate is bad news. It hurts your sender reputation and wastes your sending resources. Keeping this number low is key to a healthy email program. You can find more general benchmarks for email marketing performance [f99c].
Advanced Email Marketing Benchmarks For Deeper Insights
So, you've got the basics down â open rates, click-throughs, the whole deal. That's great! But to really get a handle on what's happening with your emails and make them work harder, you need to look a bit closer. These next few metrics give you a more detailed picture, helping you fine-tune your approach.
Click-To-Open Rate (CTOR): Gauging Content Effectiveness
This one tells you how many people who opened your email actually clicked on something inside. It's a better measure of your content's appeal than just the raw click-through rate because it filters out those who just glanced at the subject line. A high CTOR means your email body content is doing its job.
What it measures: The percentage of openers who clicked a link.
Calculation: (Total Clicks / Total Emails Opened) * 100
Why it matters: It shows if your message and call-to-action are compelling enough to make people act.
Unsubscribe Rate: Understanding Audience Sentiment
Nobody likes seeing people leave, but a small unsubscribe rate is normal. What you're looking for is a sudden spike or a consistently high rate. This tells you something might be off â maybe your content isn't relevant anymore, you're sending too often, or your audience has changed.
What it measures: The percentage of recipients who unsubscribed.
Calculation: (Total Unsubscribes / Total Emails Delivered) * 100
What to watch for: A rate above 0.5% might need investigation.
Spam Complaint Rate: Protecting Sender Reputation
This is a big one. If people mark your emails as spam, it seriously damages your ability to reach inboxes in the future. It's a direct signal to email providers that your messages aren't wanted. Keeping this rate as close to zero as possible is non-negotiable.
What it measures: The percentage of recipients who marked your email as spam.
Calculation: (Total Spam Complaints / Total Emails Delivered) * 100
Ideal target: Below 0.1%
Revenue Per Email (RPE): Quantifying Financial Impact
For businesses focused on sales, this metric is gold. It directly links your email efforts to the money you're making. It helps you understand the actual financial return from each email you send, making it easier to justify your marketing spend.
What it measures: The average revenue generated by each email sent.
Calculation: Total Revenue Generated from Email / Total Emails Sent
Usefulness: Helps compare the profitability of different campaigns or segments.
Looking at these deeper metrics helps you move beyond surface-level engagement. It's about understanding the why behind the numbers and making smarter decisions for your email strategy. Think of it like a doctor checking your vitals â you need more than just your temperature to know how you're really doing.
By paying attention to CTOR, unsubscribe rates, spam complaints, and RPE, you gain a much clearer view of your email campaign's true performance and its impact on your business. This level of detail is key for making informed adjustments and improving your overall email marketing performance.
Leveraging Email Marketing Benchmarks For Growth
So, you've got your numbers â open rates, click-throughs, the whole deal. Now what? Just looking at them isn't going to magically make your campaigns better. You've got to actually use them. Think of these benchmarks not as a report card, but as a roadmap. They show you where you are and, more importantly, where you need to go.
Setting Realistic Performance Goals
First off, don't just aim for the average. The average open rate, for instance, might be around 25.55% across all industries, but that's just a starting point. Your goal should be to beat it. When you set targets, make them specific and achievable. Instead of saying 'improve open rates,' try 'increase open rates by 3% next quarter.' This gives you something concrete to work towards. It's like training for a race; you don't just show up, you train for a specific time.
Identifying Areas for Optimization
Look at your metrics. Are your open rates good but your click-through rates (CTR) are lagging? That tells you people are opening your emails, but the content isn't grabbing them enough to click. Maybe the subject line is great, but the email body isn't delivering on the promise. Or perhaps your conversion rates are low even with a decent CTR. This could mean the landing page isn't aligned with the email, or the offer isn't compelling enough once they get there. It's all about connecting the dots between different metrics to see the full picture.
Here's a quick way to spot issues:
High Open Rate, Low CTR: Your subject lines are working, but the email content needs a serious rethink. Is it engaging? Is the call to action clear?
Low Open Rate, High CTR (for those who open): People who do open are interested, but not enough people are opening. Your subject lines or sender name might need tweaking. Maybe it's time to look at your sender reputation.
High CTR, Low Conversion Rate: The email is driving clicks, but the destination isn't converting. Check your landing page experience and offer.
High Bounce Rate: Your list is likely full of old or invalid addresses. This hurts deliverability and wastes money.
A/B Testing Strategies Based on Benchmarks
Benchmarks are perfect for guiding your A/B tests. If your CTR is underperforming, test different calls to action (CTAs) or image placements within your emails. If open rates are the issue, experiment with new subject line formats or send times. For example, you could test a question-based subject line against a benefit-driven one. Or try sending one version of an email at 10 AM and another at 2 PM to see which performs better for your audience. The key is to test one element at a time so you know exactly what change made a difference.
Benchmarks aren't static. What worked last year might not work today. The digital world moves fast, and so should your strategy. Regularly reviewing your performance against current industry averages and your own past results is how you stay ahead. Itâs about continuous improvement, not just hitting a number once.
Improving Sender Reputation Through Metrics
Your sender reputation is like your credit score for email. Metrics like bounce rate and spam complaint rate directly impact it. A high bounce rate means you're sending to bad addresses, and a high spam complaint rate means people are actively marking your emails as unwanted. Both are red flags to email providers (like Gmail or Outlook) and can lead to your emails landing in the spam folder, or worse, getting blocked entirely. By actively cleaning your list and monitoring these rates, you protect your ability to reach your audience. Itâs a bit like keeping your house tidy; it makes visitors feel more welcome.
Industry-Specific Email Marketing Benchmarks
So, you've got your general email marketing numbers looking pretty good. That's awesome. But here's the thing: not all emails, and not all audiences, are created equal. What works for a fashion brand might totally flop for a software company. It's super important to compare your results against others in your specific field. Trying to hit the average open rate for, say, the travel industry when you're selling industrial equipment just isn't going to give you a clear picture.
How Benchmarks Vary Across Sectors
Think about it. A quick email about a flash sale for a clothing store is going to get a different reaction than a detailed newsletter explaining a new financial product. The urgency, the content, the audience's expectations â it all shifts. For instance, a transactional email confirming an order will likely have a much higher open rate than a promotional blast. We're seeing conversion rates, for example, swing wildly. A good email marketing conversion rate can be anywhere from 2% to 5% generally, but that's just a starting point. For a high-ticket item, hitting 2% is fantastic. For something like groceries, where repeat purchases are common, you might see numbers much higher, like 7.9% or more.
Here's a peek at how conversion rates can look in different areas:
Industry | Conversion Rate |
|---|---|
Beauty | 1.92% |
Fashion | 1.4% |
Fintech | 5.8% |
Pets | 2.77% |
Food and beverage | 0.19% |
Grocery | 7.9% |
Furniture and home goods | 3.03% |
Retail | 2.25% |
Travel and hospitality | 2.25% |
Comparing Your Performance Against Averages
When you're looking at your own campaign data, always ask yourself: who am I comparing this to? Are they sending similar types of emails? Do they have a similar list size? Are they targeting a similar customer base? If you're sending out a welcome series, you'd want to look at the benchmarks for welcome series, not just general broadcast emails. Automated flows, like abandoned cart reminders, often perform way better than one-off campaigns. We're talking 10-15% recovery for abandoned carts, which is a huge difference from a standard 1-5% for broadcast messages. Keeping an eye on these specific email marketing benchmarks helps you see where you're truly excelling and where you might be falling behind.
Tailoring Strategies to Your Industry
So, what does this mean for you? It means you can't just use a one-size-fits-all approach. If your open rates are consistently lower than the general average, maybe it's time to rethink your subject lines or sending times. A typical email open rate might hover around 15-25%, but if your industry is known for lower engagement, that average might be your target. You need to adjust your expectations and your strategies based on what's realistic for your niche. For example, if you're in B2B manufacturing, your conversion rate might be around 2.18%, and that's perfectly fine. But if you're in retail and you're only hitting 0.5%, you've got some work to do. It's all about context.
Understanding these industry nuances is key. It stops you from getting discouraged by numbers that aren't relevant to your business and helps you focus on making real improvements where they count. Don't just aim for the average; aim to be the best in your specific sector.
Regularly checking your performance against industry-specific data helps you:
Identify realistic goals for your campaigns.
Spot opportunities to improve specific metrics like click-through rates or conversion rates.
Understand what kind of content truly connects with your audience.
Make smarter decisions about your email marketing budget and efforts.
By focusing on benchmarks that actually matter to your business, you can refine your approach and see better results over time.
Maximizing ROI With Email Marketing Benchmarks
So, you've been tracking all those numbers â open rates, click-throughs, the whole deal. That's great. But how do you actually turn those metrics into more money in the bank? Itâs not just about sending emails; itâs about making sure those emails are actually doing something for your business. Think of benchmarks not just as scores, but as a roadmap to better profits.
Connecting Metrics to Business Value
Itâs easy to get lost in the weeds with data. But every number should point back to what matters: revenue, customer loyalty, and overall business growth. For instance, a high click-through rate (CTR) is good, but what happens after the click? Does it lead to a sale? A sign-up? A demo request? That's the real value. We need to see how our email efforts directly impact the bottom line. Some studies show email marketing can bring in a return of $45 for every $1 spent, which is pretty wild when you think about it. Email marketing offers a significant return on investment (ROI).
Demonstrating Email Marketing's Profitability
Showing that email marketing is a money-maker isn't always straightforward. You need to connect the dots between your campaigns and actual sales. This means looking beyond just engagement metrics and focusing on conversion rates and, ultimately, revenue per email (RPE). If your campaigns are driving more purchases or higher-value actions, you can confidently say email is paying for itself, and then some.
Hereâs a simple way to think about it:
Engagement Metrics (Opens, Clicks): These show people are interested.
Action Metrics (Conversions): These show people are doing what you want them to do.
Revenue Metrics (Sales, RPE): This shows you're making money.
Optimizing for Customer Lifetime Value (LTV)
Beyond the immediate sale, think about the long game. How are your emails helping you keep customers around and spending more over time? This is where Customer Lifetime Value (LTV) comes in. Benchmarks can help you see if your email strategies are building loyalty. Are welcome series emails leading to repeat purchases? Are post-purchase follow-ups reducing churn? By keeping your email list clean and sending relevant content, you're not just making a sale today; you're building a relationship that pays off for years. Maintaining a clean and accurate email list is key here, as it ensures you're talking to people who actually want to hear from you, making them more likely to stick around.
The real win with email marketing isn't just getting someone to open an email or click a link. It's about building a relationship that encourages repeat business and makes customers feel valued over the long haul. That's how you get the best return, not just once, but again and again.
Wrapping It Up
So, we've looked at what's working in email marketing for 2026. It's clear that just sending emails isn't enough anymore. You've got to pay attention to the numbers, like how many people open your emails and click on things. These benchmarks aren't just random figures; they're a roadmap. Use them to see where you stand and where you can do better. Remember, the goal isn't just to hit the average, but to beat it. Keep an eye on these metrics, make smart adjustments, and your email campaigns will thank you for it.
Frequently Asked Questions
What exactly are email marketing benchmarks?
Think of benchmarks as a way to measure how well your emails are doing compared to others. They are like target scores, such as how many people open your emails or click on links, that help you see if your campaigns are performing well or need improvement.
Why should I care about these email benchmarks?
Benchmarks are super important because they show you if your emails are hitting the mark. They help you understand what's working and what's not, so you can make your emails better and get more people to pay attention and take action.
What are the most important things to track in my emails?
You should definitely keep an eye on how many people open your emails (open rate), how many click on the links inside (click-through rate), and how many actually do what you want them to do, like buying something (conversion rate). Also, watch out for emails that don't get delivered (bounce rate).
Can I use benchmarks to make my emails better?
Absolutely! By looking at benchmarks, you can find out which parts of your emails aren't doing so well. This helps you try new things, like changing your subject lines or the pictures you use, to see if you can get better results.
Do the best email numbers change depending on the type of business?
Yes, they do! What's considered good for an online store might be different for a news website. It's important to compare your results to businesses that are similar to yours to get a clearer picture.
How can tracking benchmarks help my business make more money?
When you know what works best in your emails, you can send more effective messages. This leads to more people clicking, buying, and becoming loyal customers, which directly boosts your business's earnings and shows how valuable email marketing is.
Other Blogs
Other Blogs
Check our other project Blogs with useful insight and information for your businesses


Other Blogs
Other Blogs
Check our other project Blogs with useful insight and information for your businesses